Instructor: Dr. Stephen Hanna (UMW Dept. Geography)
Semester: Fall 2025
Program Experience: Esri ArcGIS Pro
Lab descriptions are attributed to those given by Dr. Hanna.
Lab 3: Building the GIS Database
September 24, 2025
In this lab, I created a GIS model of Fredericksburg that contains both present-day and historical data. To build this model, I 1) used ArcGIS Pro Catalog tools to create a geodatabase and directory structure for that data; 2) downloaded and decompressed both raster and vector data; 3) utilized projection and import tools to make sure all data files are in the same coordinate system and are all located in the geodatabase; 4) used ArcGIS Pro to edit some of the data files so they fit the study area; and 5) created new feature classes containing historical features digitized from Gray’s 1878 Map of Fredericksburg.
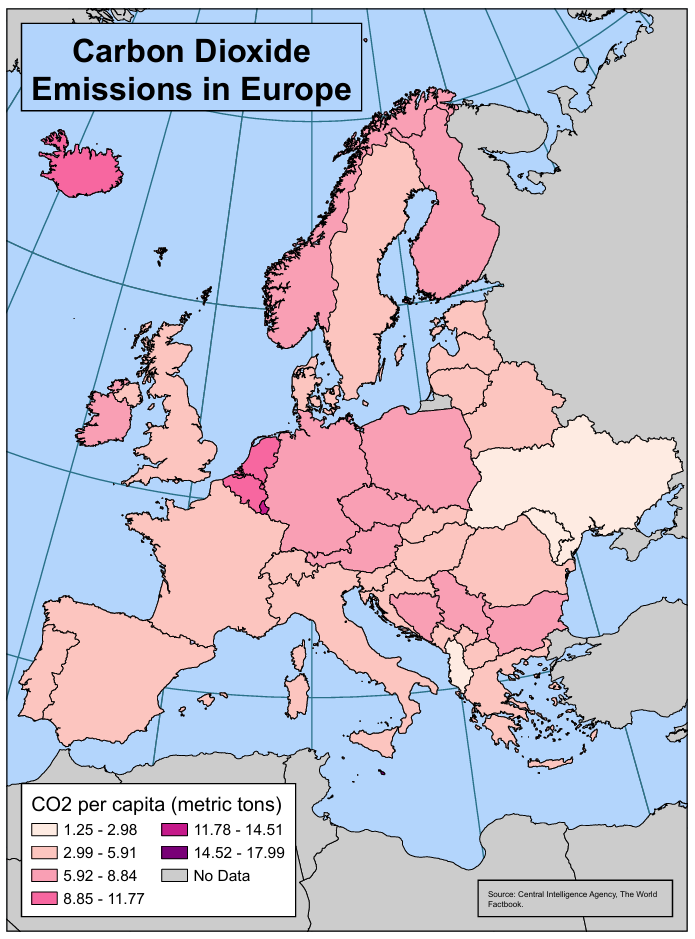
Lab 4: Making a Classed Choropleth Map
October 8, 2025
In this lab, I created a choropleth map of CO2 emissions per capita by country in Europe as of 2022. To do this, I created a new geodatabase, applied what I had learned about working with attribute data, and learned to use the layout functions in ArcGIS Pro to create a map with a title, legend, and source information. Working with attribute data included preprocessing the data, calculating descriptive statistics, creating a simple frequency histogram, and using this information to choose and appropriate classification method for the map.
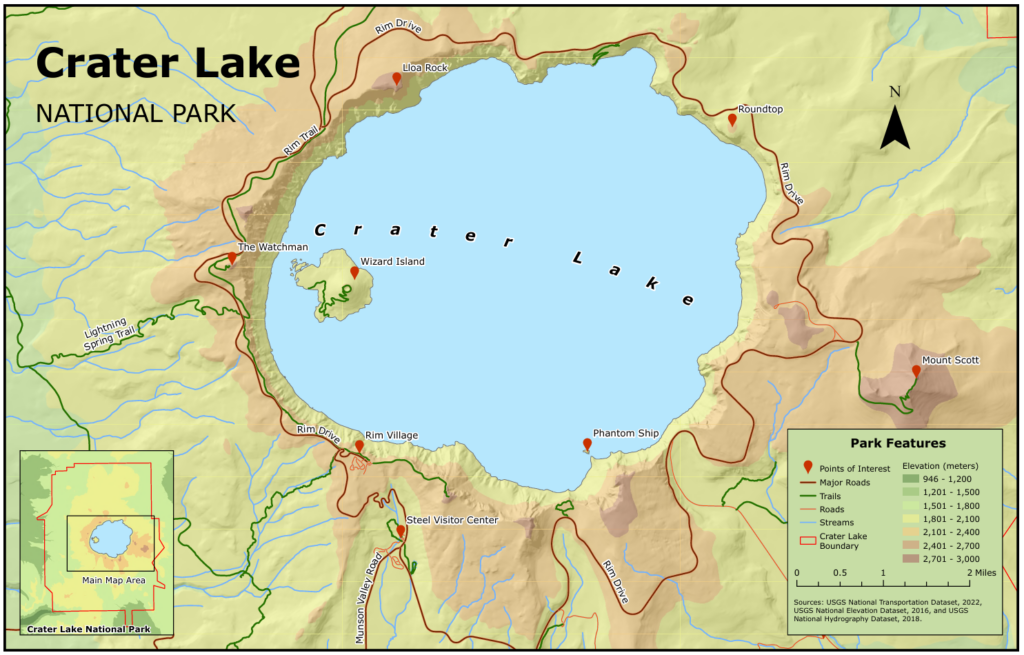
Lab 5: Map Design in ArcGIS
October 22, 2025
In this lab, I created a map of Crater Lake National Park in Oregon from a geodatabase that I assembled. The map emphasizes the most famous features of the portion of the park surrounding Crater Lake and uses elevation as background information. Creating this map required me to download data, use selection and classification to generalize the feature classes and raster datasets provided, and learn ArcGIS Pro layout tools to create the final map. I employed the design guidelines we covered in class, including the principles of planar organization, figure-ground relationships, symbol design, and typography.
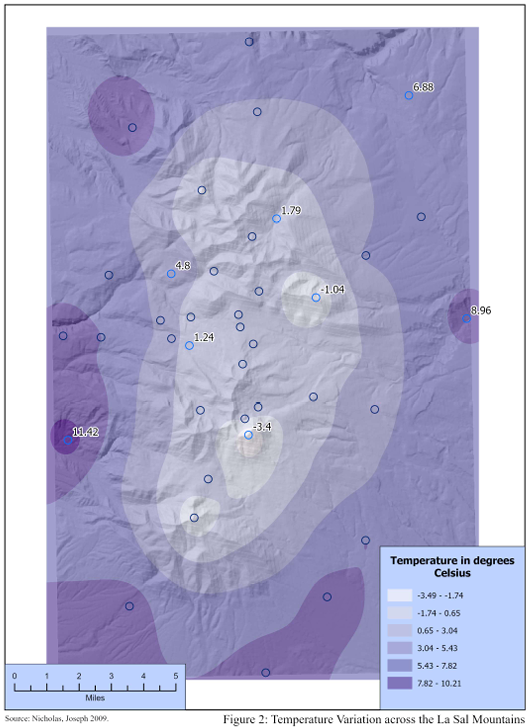
Lab 6: Mapping Surfaces and 3D Modeling
November 5, 2025
This lab had two purposes: 1) to create a raster GIS data model (ArcGRID floating point file format) of temperature variations across the La Sal Mountains of Utah and 2) to evaluate that model given what we know about interpolation and the known relationships between temperature and topographic variables like elevation, slope, and aspect. To do this, I used a variety of ArcGIS Spatial Analyst tools to better understand the topography of the study area before I created a raster data model of temperature using interpolation tools. I also learned to create a 3D map to help readers visualize the relationships between elevation and temperature as part of the evaluation of the raster model of temperature that I created.
Lab 7: Vector Analysis in GIS
November 19, 2025
In this lab, I used a variety of vector analysis tools to solve geospatial problems in two separate scenarios. Each required that I use these tools to test hypotheses or conduct a location analysis.
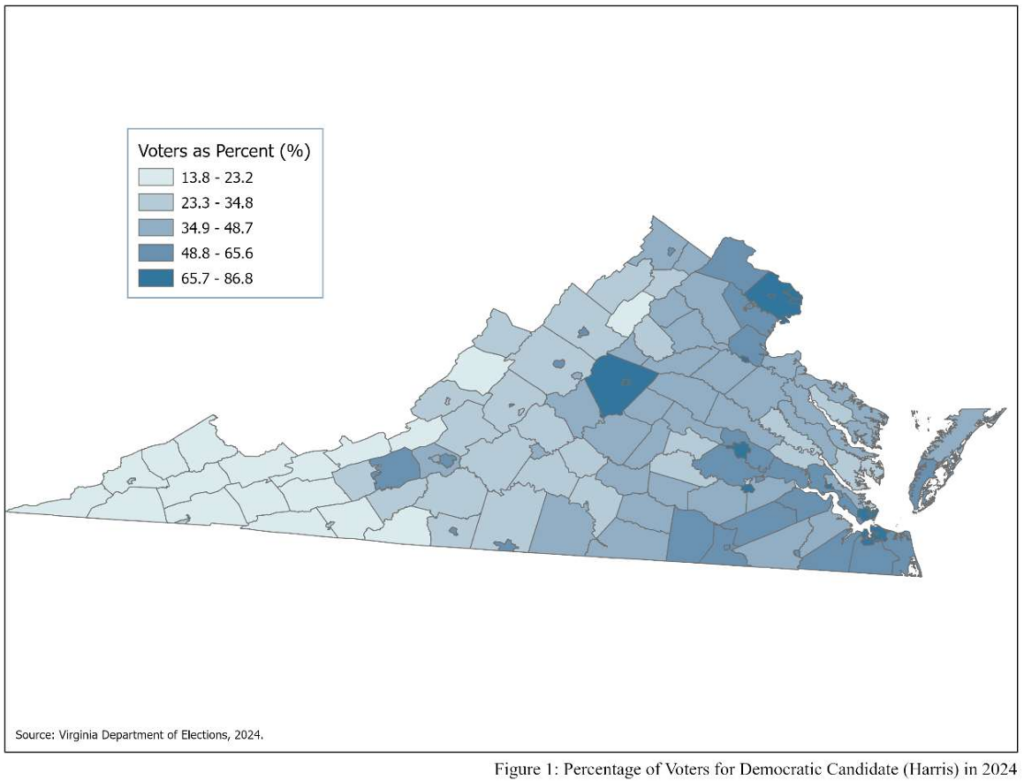
Scenario 1: Explaining Support for Democratic Presidential Election Candidates
In the first scenario, I used a basic selection query and statistical tools to test the hypothesis that during the 2024 presidential election, counties where a significantly higher percentage of adults had earned a bachelor’s degree were more likely to support the Democratic Party’s presidential candidate.
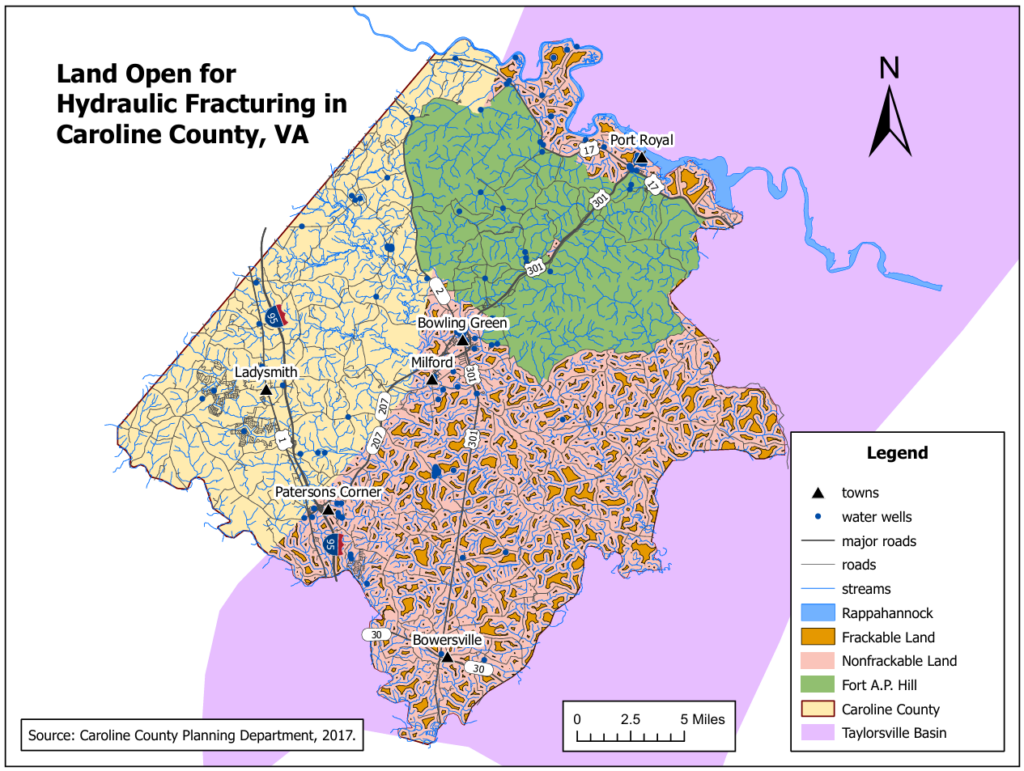
Scenario 2: Protecting Residents and Water Resources from Hydraulic Fracturing in Caroline County
In the second scenario, I used a combination of buffer and overlay analysis to limit where hydraulic fracturing gas drilling can occur in Caroline County.
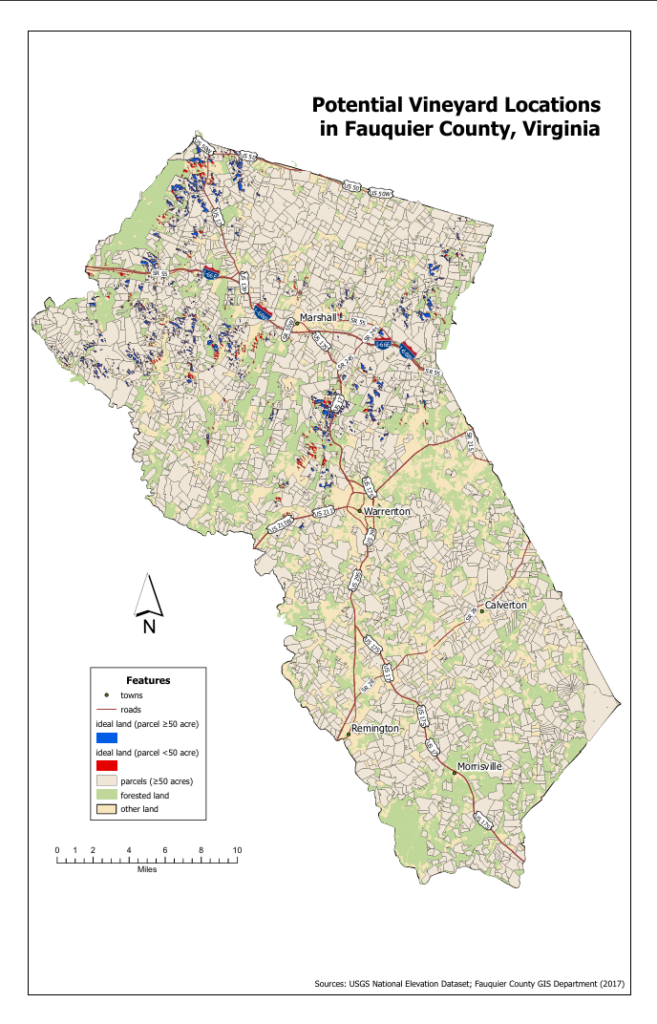
Lab 8: Raster Analysis in GIS
December 5, 2025
In this lab, I used raster analysis techniques to identify areas in Fauquier County, Virginia, that are most suitable for wine grape cultivation. This involved reading a synopsis of the literature on vineyard location in Virginia, developing a GIS model based on that literature, and then performing a series of raster analysis functions to determine which areas have the required location factors for a successful vineyard. This allowed me to identify suitable vineyard sites and determine whether they are within parcels with the requisite zoning and size to support a winery.